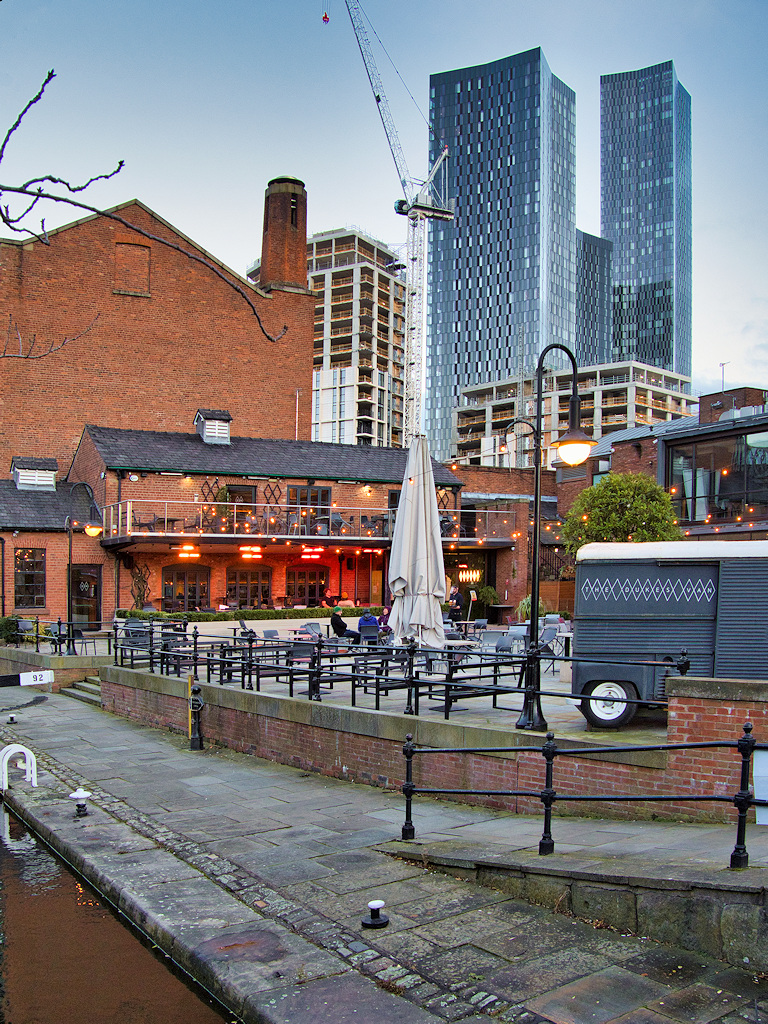

Manchester: the £74%-a-decade city where the cheap end runs hottest
No big English city has had a stronger ten years. But the real story in the sold-price record isn’t Deansgate’s towers — it’s the terraces of Gorton, Blackley and Little Hulton quietly closing the gap on the leafy south.
Written by Housometer · audited against HM Land Registry data, July 2026 · tables update automatically
The shape of the market
Manchester’s headline numbers read like two different cities. The typical sale is £235,000 — which, remarkably, still ranks it only 739th of the 1,050 towns we track, cheaper than most of the South East’s commuter belt. Yet the ten-year growth figure is +74% — comfortably ahead of Bristol (+48%) and York (+38%) over the same decade, and among the strongest of any major English city in our data. Manchester is no longer cheap by northern standards; it is simply catching up from a very long way back.
Two structural quirks matter for buyers. First, this is a leasehold city: 50.7% of recorded sales are leasehold — partly the city-centre flat market, partly the North West’s old leasehold-house tradition — so the lease term, ground rent and service charge deserve as much scrutiny as the price. Second, the spread is wide: a tenth of homes sell under £125,000 while the top tenth clears £425,000, which is why an area average tells you very little about the street you’re actually viewing.
£1m+ streets in Manchester today: 3 (five years ago: 1) — see the national analysis →
Where prices are actually moving
Rank Manchester’s districts by their five-year move and the pattern is unmissable: the cheaper the district, the harder it has run. Little Hulton (M38) leads the whole city at +65% — to a median of just £166,000. Wythenshawe and Baguley (M23) at +53%, Droylsden (M43) and Gorton (M18) at +50%, Blackley (M9) at +49%: the entire top of the movers’ table is the city’s value end, as buyers priced out of the middle push outward along the tram lines.
Meanwhile the postcodes that used to make the headlines have gone quiet. Didsbury (M20) managed +18% — barely a quarter of Little Hulton’s pace — and the city-centre districts are the slowest in Manchester: M1 +23%, M3 just +5%, dragged by a flat market that has never fully recovered its pricing power. The five-year record says the gap between “premium Manchester” and the rest is narrowing, street by street.
The streets at the top
Didsbury owns Manchester’s street-level summit. Belfield Road (M20) leads the city at a £1.24m median, with Old Broadway and Pine Road — both also M20 — right behind; Chorlton’s Chandos Road South is the strongest street outside Didsbury at £900,000. Five years ago Manchester had one street with a £1m+ median; today it has three. The million-pound club is still tiny for a city this size — which is exactly why the members are so consistent: broad Victorian and Edwardian family houses on quiet roads between Didsbury village and the Mersey.
Where to live: an honest guide
Six areas we’d actually shortlist, with the district median beside each. The right answer depends on your commute, your school needs and your budget — these notes are the conversation we’d have before you book viewings.
West Didsbury’s Burton Road does the restaurants, East Didsbury does the school catchments, and the streets in between do £1m+ when they’re wide enough. Growth has been the city’s slowest recently (+18% over five years) — you’re buying maturity, not momentum.
A £404,000 district median makes Chorlton south Manchester’s second market, and Chorltonville’s arts-and-crafts closes are some of the city’s loveliest streets. It has kept more pace than Didsbury (+28%) while staying meaningfully cheaper.
Ancoats is the flag-bearer for Manchester flats, but the sold-price record is honest: M4’s median is £255,000 and city-centre districts have been the city’s slowest movers. That cuts both ways — weak momentum, but genuine negotiating room, and leases need proper checking.
A £270,000 median with +42% five-year growth is exactly what gentrification looks like in the data. The A6 corridor is still rough at the edges; the streets around Cringle Park and the station are where the momentum is concentrated.
Prestwich has quietly become the north side’s premium: a £290,000 median, +32% in five years, and semis near the park that compete with south Manchester on quality without its price. Castle Hill Road makes the city’s top-street table at £765,000.
The Trafford borough effect in affordable form: a £320,000 median (+26%) buys interwar semis on tree-lined roads with some of Greater Manchester’s most consistently strong schools. Less fashionable than Chorlton, and priced accordingly.
The Housometer read
Houses have beaten flats in Manchester for a decade, and the movers’ table says that trade still has room: the value corridors — Levenshulme, Prestwich, the M43/M18 belt — are where the momentum lives, while the centre’s flat market offers negotiating leverage rather than growth. Wherever you land, two checks matter more here than in most cities: the lease (half of all sales are leasehold — our report reads the registered term and flags short leases automatically) and the street-level picture on crime and schools, which swings block by block on the north and east side. Run the exact address before you offer, not the district average.
Found a street you like? Check the actual home.
A Housometer report runs every check in this article — value against the street’s own sales, flood and ground risk, crime, schools, noise, planning and tenure — for any Manchester address.
Free Home Confidence Score first · full report £5 · 14-day no-quibble refund
Figures from HM Land Registry Price Paid Data (© Crown copyright, OGL v3.0), analysed by Housometer; street £/m² joins EPC floor areas (MHCLG). Tables refresh automatically as sales are registered; the commentary was written July 2026 and is guidance, not advice. The Land Registry’s “Manchester” town field extends beyond the council boundary into its postal hinterland. Photo: David Dixon · CC BY-SA 2.0.