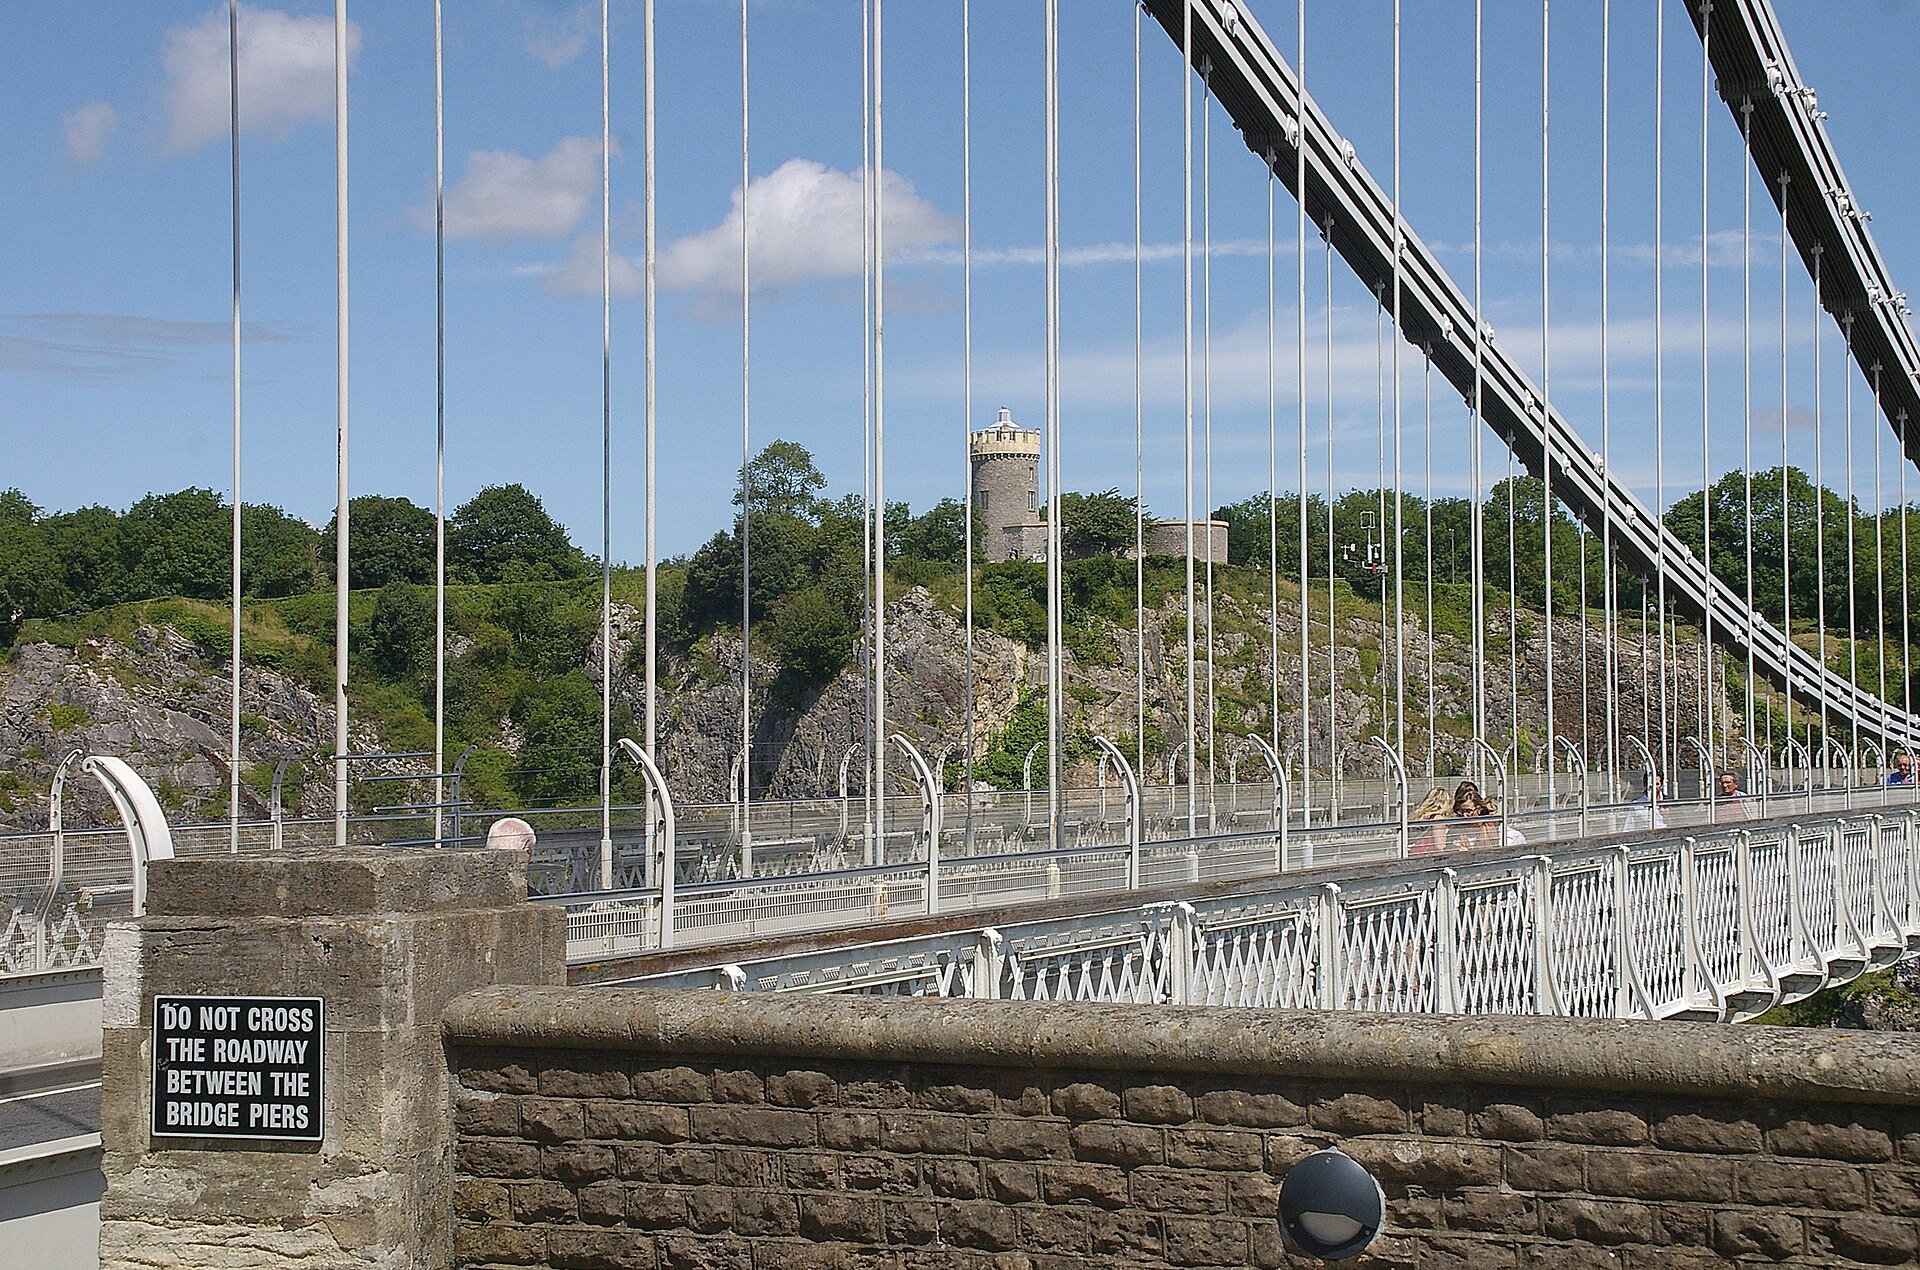

Bristol: the city that minted sixteen millionaire streets in five years
The West Country’s capital had London’s decade in miniature — a surge, a spread east, and now a pause. The sold-price record shows exactly where the heat went, and where the bargaining power has returned.
Written by Housometer · audited against HM Land Registry data, July 2026 · tables update automatically
The shape of the market
Bristol is the most expensive big city in our data outside the South East: a £345,000 median across 36,800 sales in three years, with an average of £434,000 pulled upward by a genuinely deep premium tail — the top tenth of sales clears £635,000. The decade’s growth (+48%) landed earlier here than elsewhere; the last twelve months, at +0.2%, are effectively flat. After the pandemic-era surge of London leavers, the market is holding its level rather than climbing.
The single most striking figure in Bristol’s record is at street level: nineteen of its streets now carry a £1m+ median over the last five years of sales. Five years ago, three did. No other city we track has minted millionaire streets at anything like that rate — it’s the clearest possible signature of a premium market that broadened out from Clifton across the whole north-west quarter.
£1m+ streets in Bristol today: 19 (five years ago: 3) — see the national analysis →
The east-west flip
Rank Bristol’s districts by their five-year move and the city flips on its axis. The old money stood still: Clifton (BS8) grew just +6%, Redland and Cotham (BS6) +14%, and the central BS1 flat market actually fell (−2%). The running was made east and north of the centre — Easton and St George (BS5) top the city at +32% to a £330,000 median, with Shirehampton (BS11) and Brentry/Henbury (BS10) both at +30%.
This is the classic affordability cascade: buyers priced out of the £440k–£450k inner-north districts moved along the Bristol–Bath railway path and the M32 corridor, and the sold-price record shows the wave landing. BS5’s median has closed to within 15% of Bedminster’s (BS3) — a gap that was closer to a third five years ago.
The streets at the top
The top of Bristol’s street table splits into two kinds of money. On the city’s wooded north-west edge sit the classic prizes — Old Sneed Park and Old Sneed Road in Stoke Bishop (BS9), and Cadbury Camp Lane out beyond the gorge, where seven sales carry a £2.2m median. Inside the city, the interesting entry is Berkshire Road in Bishopston (BS7): a £1.2m median from ordinary-width Victorian terraces at £8,250 per square metre — the most intensely priced street in the top ten, and proof that the premium has spread well beyond Clifton’s Georgian set pieces.
Where to live: an honest guide
Seven areas we’d shortlist, spanning the full price ladder — with the district median beside each. Bristol is a city of strong micro-markets; treat these as starting points and check the specific street.
A £450,000 district median understates Clifton proper, where the crescents trade far higher. The five-year record (+6%) says you’re buying a finished market: prestige and permanence, not growth. Flats dominate the lower rungs and deserve lease and service-charge scrutiny.
The family heartland: £443,000 median, Elgin Park on the city’s top-street table, and demand that never really switches off. Growth (+14%) has lagged the east — this is the “pay up and stay a decade” choice.
BS7 (£415,500 median, +24%) has quietly become the inner-north’s momentum market: Berkshire Road and Julius Road both make the citywide top ten. St Andrews Park streets are the sweet spot between Redland polish and Horfield value.
The south bank’s answer to Bishopston: £380,000 median, +25% in five years, and Victorian terraces that suit first movers and young families alike. Parts of Bedminster sit low near the Malago — flood risk is street-specific here, so check the exact plot.
Top of Bristol’s movers at +32% to £330,000, powered by the railway path, St George Park and sheer relative value. It remains a mixed picture street by street — exactly the place to read the crime and schools data for the specific address rather than the postcode’s reputation.
Bristol’s highest-priced district at a £578,000 median, and home to the Old Sneed Park streets at the top of the city’s table. Less fashionable than Clifton and better value per square metre for family space; school catchments do a lot of the pricing here.
A £348,250 median with +15.5% growth and huge sales volume: this is where Bristol’s ordinary buying power actually lives. Sage Road’s +504% entry on the movers table is a new-build artefact — read small-street swings with care.
The Housometer read
Bristol’s pause is the buyer’s window: a flat year citywide, a central flat market in mild retreat, and sellers in the stalled premium postcodes adjusting to the new level. The growth story has moved east — BS5 and BS16 are where the five-year record still shows genuine momentum — while BS6 and BS9 remain the capital-preservation plays. Two checks earn their keep here: flood risk on the low streets near the Avon, Frome and Malago (it varies house by house, and it moves insurance premiums), and £/m² against the street’s own record before you pay a “Bristol premium” that the comparables don’t support. Our report does both for the exact address.
Found a street you like? Check the actual home.
A Housometer report runs every check in this article — value against the street’s own sales, flood and ground risk, crime, schools, noise, planning and tenure — for any Bristol address.
Free Home Confidence Score first · full report £5 · 14-day no-quibble refund
Figures from HM Land Registry Price Paid Data (© Crown copyright, OGL v3.0), analysed by Housometer; street £/m² joins EPC floor areas (MHCLG). Tables refresh automatically as sales are registered; the commentary was written July 2026 and is guidance, not advice. The Land Registry’s “Bristol” town field extends beyond the council boundary into its postal hinterland. Photo: mattbuck · CC BY-SA 3.0.